In 2023, in line with the recommendations of the GHG Protocol Corporate Accounting and Reporting Standard, we improved the way we calculate the emissions associated with electricity consumption. At Biedronka, we started using the specific emission factors and the energy mix updated annually and made available by electricity suppliers in Poland, as was already the case for our operations in Portugal. In Colombia, this information is not yet available and data on the country’s energy mix is used. Considering the information provided by the Polish electricity sector for previous years, we also recalculated Biedronka’s scope 2 emissions for 2021 and 20221.
Based on this methodological adjustment, our scope 1 and 2 GHG emissions accounted for 929,000 tonnes of carbon dioxide equivalent (CO2e) in 2023, 6.9% more than in 2022. This increase is due mainly to the growth of our activities in Poland and Colombia, and to the increase in electricity and fuel consumption. The specific value of scope 1 and 2 emissions decreased 11.7% compared to 2022, as a result of the increased efficiency of our operations. We exceeded our goal to reduce scope 1 and 2 carbon emissions by at least 40% per 1,000 euros in sales by the end of 2023, compared to 2017, reducing emissions by 60%.
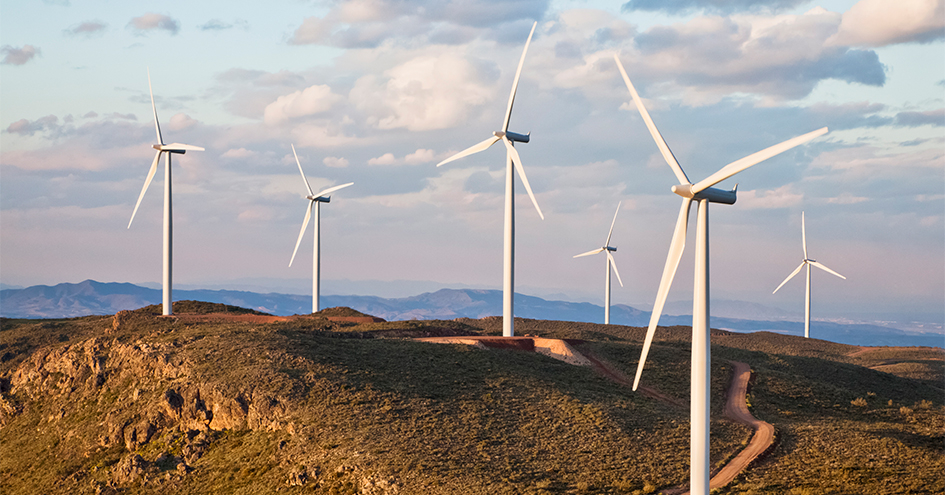
The strategy to reduce our carbon footprint, defined on a voluntary basis since our Companies’ activities are not covered by the European Emissions Trading Scheme, includes increasing operational efficiency and increasing the consumption of renewable energy, with the production of photovoltaic energy for self-consumption through Power Purchase Agreements (PPAs), Virtual Power Purchase Agreements (VPPAs) and the purchase of guarantees of origin. The 24.2% reduction in our carbon footprint, in absolute terms and compared to 2017, confirms the effectiveness of this strategy.
With regard to scope 3 emissions, particularly in the categories associated with purchased goods and services (category C1) and the end-of-life treatment of sold products (category C12), the increase recorded follows the growth trend of our businesses.
Carbon footprint (t CO2e/1,000 euros of sales) |
|
2023 |
|
2022 |
|
Δ 2023/2022 |
||||
|---|---|---|---|---|---|---|---|---|---|---|
Specific value (scopes 1 and 2) |
|
0.0303 |
|
*0.0342 |
|
-11.7% |
||||
|
||||||||||
Carbon footprint (t CO2e)1 |
|
2023 |
|
2022 |
|
Δ 2023/2022 |
||||||||||||||||||||
|---|---|---|---|---|---|---|---|---|---|---|---|---|---|---|---|---|---|---|---|---|---|---|---|---|---|---|
Overall carbon footprint (scopes 1 and 2)2 by GHG |
|
928,904 |
|
*869,337 |
|
+6.9% |
||||||||||||||||||||
Carbon dioxide (CO2) |
|
801,408 |
|
*736,051 |
|
+8.9% |
||||||||||||||||||||
Methane (CH4) |
|
19,692 |
|
*19,004 |
|
+3.6% |
||||||||||||||||||||
Hydrofluorocarbons (HFC) |
|
104,914 |
|
*111,605 |
|
-6.0% |
||||||||||||||||||||
Perfluorocarbons (PFC) |
|
0 |
|
0 |
|
- |
||||||||||||||||||||
Nitrous oxide (N2O) |
|
2,890 |
|
*2,677 |
|
+8.0% |
||||||||||||||||||||
Sulphur hexafluoride (SF6) |
|
0 |
|
0 |
|
- |
||||||||||||||||||||
Overall carbon footprint (scopes 1 and 2) |
|
|
|
|
|
|
||||||||||||||||||||
Biedronka |
|
747,290 |
|
*713,934 |
|
+4.7% |
||||||||||||||||||||
Hebe |
|
21,200 |
|
20,583 |
|
+3.0% |
||||||||||||||||||||
Pingo Doce3 |
|
40,536 |
|
42,745 |
|
-5.2% |
||||||||||||||||||||
Recheio |
|
3,977 |
|
*3,187 |
|
+24.8% |
||||||||||||||||||||
Ara |
|
91,384 |
|
*65,335 |
|
+39.9% |
||||||||||||||||||||
JMA4 |
|
24,372 |
|
*23,406 |
|
+4.1% |
||||||||||||||||||||
Hussel/Jeronymo5 |
|
145 |
|
*147 |
|
-1.4% |
||||||||||||||||||||
Carbon footprint (scope 1 – direct impacts)6 |
|
240,466 |
|
*227,719 |
|
+5.6% |
||||||||||||||||||||
Leakage of refrigerant gases |
|
104,976 |
|
*111,669 |
|
-6.0% |
||||||||||||||||||||
CO2 usage |
|
29,166 |
|
25,755 |
|
+13.2% |
||||||||||||||||||||
Fuel consumption |
|
65,459 |
|
52,858 |
|
+23.8% |
||||||||||||||||||||
Light vehicle fleet |
|
21,788 |
|
*18,977 |
|
+14.8% |
||||||||||||||||||||
Emissions from agriculture and livestock farming7 |
|
19,077 |
|
*18,460 |
|
+3.3% |
||||||||||||||||||||
Carbon footprint (scope 2 – indirect impacts) |
|
688,438 |
|
*641,618 |
|
+7.3% |
||||||||||||||||||||
Electricity consumption (location-based) |
|
755,226 |
|
*753,496 |
|
+0.2% |
||||||||||||||||||||
Electricity consumption (market-based) |
|
674,051 |
|
*622,080 |
|
+8.4% |
||||||||||||||||||||
Heating (location-based) |
|
14,387 |
|
19,538 |
|
-26.4% |
||||||||||||||||||||
Carbon footprint (scope 3 – other indirect impacts) |
|
32,593,713 |
|
*28,960,529 |
|
+12.5% |
||||||||||||||||||||
Poland |
|
23,108,168 |
|
*20,447,987 |
|
+13.0% |
||||||||||||||||||||
Portugal |
|
6,106,242 |
|
*5,947,187 |
|
+2.7% |
||||||||||||||||||||
Colombia |
|
3,379,303 |
|
*2,565,355 |
|
+31.7% |
||||||||||||||||||||
Carbon footprint (scope 3 – other indirect impacts) |
|
|
|
|
|
|
||||||||||||||||||||
C1. Purchased products and services |
|
28,051,367 |
|
24,694,613 |
|
+13.6% |
||||||||||||||||||||
C2. Capital goods |
|
627,556 |
|
*511,612 |
|
+22.7% |
||||||||||||||||||||
C3. Fuel and energy related activities |
|
307,489 |
|
309,982 |
|
-0.8% |
||||||||||||||||||||
C4. Upstream transport and distribution |
|
256,781 |
|
*261,510 |
|
-1.8% |
||||||||||||||||||||
C5. Waste produced in operations |
|
57,091 |
|
49,268 |
|
+15.9% |
||||||||||||||||||||
C6. Work travel |
|
4,841 |
|
3,359 |
|
+44.1% |
||||||||||||||||||||
C7. Commuting |
|
20,813 |
|
20,392 |
|
+2.1% |
||||||||||||||||||||
C8. Assets rented upstream |
|
- |
|
- |
|
- |
||||||||||||||||||||
C9. Downstream transport and distribution |
|
- |
|
*- |
|
- |
||||||||||||||||||||
C10. Transformation of products sold |
|
799 |
|
780 |
|
+2.4% |
||||||||||||||||||||
C11. Use of products sold |
|
1,798,879 |
|
1,822,447 |
|
-1.3% |
||||||||||||||||||||
C12. End-of-life treatment of products sold |
|
1,458,531 |
|
1,276,387 |
|
+14.3% |
||||||||||||||||||||
C13. Assets rented downstream |
|
- |
|
- |
|
- |
||||||||||||||||||||
C14. Franchises8 |
|
- |
|
- |
|
- |
||||||||||||||||||||
C15. Investments |
|
9,566 |
|
*10,179 |
|
-6.0% |
||||||||||||||||||||
|
||||||||||||||||||||||||||
Approximately 95% of our scope 3 emissions are associated with the production, use and end-of-life treatment of the products we sell. Collaboration with our suppliers, in particular with those that have the greatest impact on our scope 3 emissions, aims at increasing the resilience of our value chain and reducing C1 emissions, in line with the scope 3 emissions reduction target set in the Climate Transition Plan.
1 More information can be found at http://www.jeronimomartins.com/cr-documents-2023.