Annual Report 2025

Carbon footprint

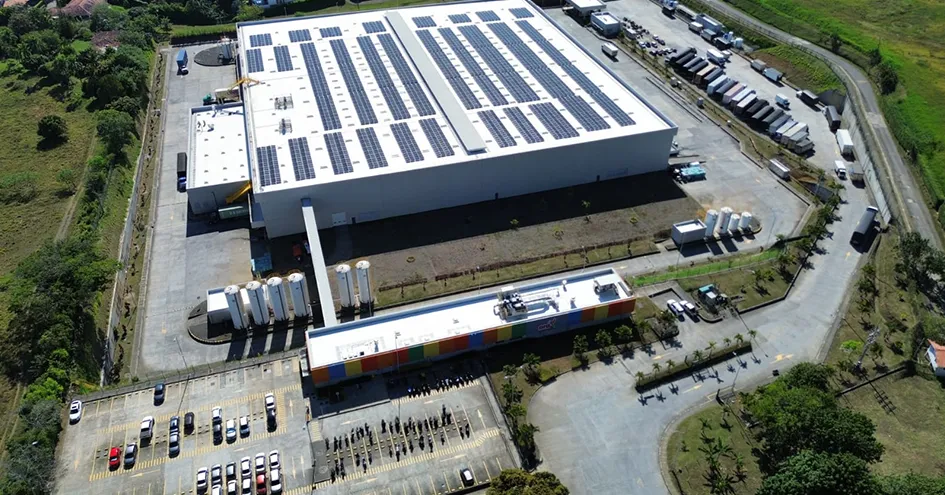
Our scopes 1 and 21 GHG emissions amounted to around 786 thousand tonnes of carbon dioxide equivalent (CO2e) in 2025, 0.2% more than in 2024 and 18.4% less than in 2021, which is defined as the base year for our commitments aligned with the SBTi and our Climate Transition Plan. The slight increase in absolute Scope 1 and 2 emissions is explained by the expansion of our store network (we opened more than 400 stores in 2025) and by the operations of Supreme Fruits and Tasty Fruits within JMA. In addition, and unlike in 2024, emission factors increased in Poland and Colombia, associated with the El Niño phenomenon and with lower water availability and reduced hydroelectric production.

Aerial shot of a distribution centre including the parking lots. Solar panels can be seen on the roof (photo)

Despite the slight increase in absolute scopes 1 and 2 emissions, there was a 0.9% reduction compared with 2024 in energy and industry emissions, thus contributing to our reduction targets for these emissions. This reduction is mainly justified by the investment in the purchase and generation of renewable energy, the improved process and equipment efficiency and the acquisition of refrigeration systems using natural refrigerant gases or refrigerants with a low global warming potential (GWP).

Scopes 1 and 2 emissions (2025 and 2024) by GHG

Carbon footprint (t CO2e)1


2025


20242


Δ 2025/2024

Overall carbon footprint (scopes 1 and 2) by GHG


786,189


784,418


+0.2%

Carbon dioxide (CO2)


653,972


672,864


-2.8%

Methane (CH4)


31,200


22,551


+38.4%

Hydrofluorocarbons (HFC)


97,734


85,695


+14.0%

Perfluorocarbons (PFC)


0


0


Nitrous oxide (N2O)


3,286


3,308


-0.7%

Sulphur hexafluoride (SF6)


0


0


Overall carbon footprint (scopes 1 and 2)


786,189


784,418


+0.2%

Biedronka (Poland)


573,611


609,632


-5.9%

Biedronka (Slovakia)


772


0


Hebe


17,221


21,559


-20.1%

Pingo Doce3


27,269


31,348


-13.0%

Recheio


2,812


3,758


-25.2%

Ara


123,763


87,989


+40.7%

JMA


39,597


28,749


+37.7%

Hussel/Jeronymo


1,144


1,383


-17.3%

Carbon footprint (scope 1 – direct impacts)


242,572


204,133


+18.8%

Refrigerant leaks


97,799


85,768


+14.0%

CO2 usage


30,458


28,796


+5.8%

Stationary fuel combustion


59,526


45,746


+30.1%

Mobile fuel combustion


23,262


20,750


+12.1%

Emissions from agriculture and livestock farming


31,527


23,073


+36.6%

Biogenic CO2 emissions from biomass combustion or biodegradation4


0


0


Carbon footprint (scope 2 – indirect impacts)5


543,617


580,285


-6.3%

Electricity consumption (market-based)


518,738


567,718


-8.6%

Heating (market-based)


24,879


12,568


+98.0%

Electricity consumption (location-based)


608,344


748,027


-18.7%

Heating (location-based)


33,532


19,311


+73.6%

Biogenic CO2 emissions from biomass combustion or biodegradation4


0


0


Carbon footprint (Scopes 1 and 2 – Forest, Land and Agriculture (FLAG))


33,089


24,657


+34.2%

Carbon footprint (Scope 1 – Energy and Industry)


209,483


179,476


+16.7%

Carbon footprint (Scope 2 – Energy and Industry)


543,617


580,286


-6.3%

Carbon footprint (Scopes 1 and 2 – Energy and Industry)


753,100


759,761


-0.9%

Net revenue (million euros)


35,991


33,464


+7.6%

1

The Group Companies did not purchase carbon credits to offset their Scope 1, 2 or 3 emissions, nor did they develop removal or storage projects within their operations or value chain.

2

Value adjusted following an update to the calculations for the Companies Hebe, Hussel and Jeronymo.

3

For the calculation of the environmental indicators reported in this subchapter, distribution centres, head office buildings and trucks used for the distribution of goods were accounted for under Pingo Doce.

4

Biogenic emissions were not accounted for due to the absence of specific information on the actual biofuel content of the purchased blends. In the absence of supplier data on the effective fuel composition, consumption was assumed to be entirely fossil‑based.

5

Information related to electricity purchased and grouped with instruments such as Guarantees of Origin or renewable energy certificates can be found in “ESRS – European Sustainability Reporting Standards”. Greenhouse gas emissions associated with guarantees of origin are estimated according to the electricity consumption established in the contract, as the actual value is only made available after the publication of the Annual Report.

Scopes 1 and 2 emissions (2025 and 2024) per country

Carbon footprint (t CO2e)1
Scopes 1 and 2 emissions per country


2025


2024


Δ 2025/2024

Poland


590,633


*631,107


-6.4%

Colombia


123,763


87,989


+40.7%

Portugal


70,515


*65,050


+8.4%

Slovakia


950


0.3


Morrocco


306


188


+62.8%

Czechia


20


85


-76.5%

*

Value adjusted following an update to the calculations for the Companies Hebe, Hussel and Jeronymo.

1

The Group Companies did not purchase carbon credits to offset their Scope 1, 2 or 3 emissions, nor did they develop removal or storage projects within their operations or value chain.

Scope 3 emissions (2025 & 2024)

Carbon footprint (t CO2e)1
scope 3 – other indirect impacts


2025


20242


Δ 2025/2024

Carbon footprint (scope 3) per country


30,223,284


33,179,124


-8.9%

Poland


20,386,437


23,255,905


-12.4%

Portugal


6,057,347


6,360,378


-4.6%

Colombia


3,725,616


3,552,267


+4.8%

Morocco


8,689


9,423


-7.8%

Slovakia


44,881


8


Czechia


314


1,143


-72.5%

Carbon footprint (scope 3) per category


30,223,284


33,179,124


-8.9%

C1. Purchased products and services


25,972,816


29,126,300


-10.8%

C2. Capital goods


594,472


452,588


+31.3%

C3. Fuel and energy related activities


269,362


296,397


-9.1%

C4. Upstream transport and distribution


272,298


267,219


+1.9%

C5. Waste produced in operations


53,272


55,254


-3.6%

C6. Work travel


3,280


3,691


-11.1%

C7. Commuting


22,349


21,108


+6.1%

C8. Assets rented upstream


C9. Downstream transport and distribution


C10. Transformation of products sold


569


1,425


-60.1%

C11. Use of products sold


1,658,918


1,624,066


+2.1%

C12. End of life of products sold


1,366,193


1,320,803


+3.4%

C13. Assets rented downstream


C14. Franchises


C15. Investments


9,755


10,273


-5.0%

Biogenic CO2 emissions from biomass combustion or biodegradation


0


0


Net revenue (million euros)


35,991


33,464


+7.6%

1

The Group Companies did not purchase carbon credits to offset their Scope 1, 2 or 3 emissions, nor did they develop removal or storage projects within their operations or value chain.

2

Value adjusted following an update to the calculations.

Note 1: The calculation of the carbon footprint of the different activities follows the methodology of the Greenhouse Gas Protocol of the World Business Council for Sustainable Development (WBCSD) and the World Resources Institute (WRI), across its three levels: direct, indirect and third‑party impacts. Scope 1 and 2 emissions correspond to activities under the Group’s financial control and account for 99.996% of turnover. The values presented took into account the following for Scope 1 and 2: (i) refrigerant gases – emission factors defined by the IPCC; (ii) chemical fertilisers – emission factors defined by the IPCC and the Portuguese Environment Agency; (iii) enteric emissions from cattle, sheep, goats and manure management (methane emissions) – emission factors defined by the Portuguese Environment Agency; (iv) fuels and heating – emission factors defined by Portugal’s Directorate‑General for Energy and Geology, Colombia’s Unidad de Planeación Minero‑Energética and Poland’s Krajowy Ośrodek Bilansowania i Zarządzania Emisjami (National Centre for Emissions Balancing and Management); (v) electricity – emission factors defined by the International Energy Agency (location‑based electricity), suppliers (market‑based electricity in Portugal, Poland and Slovakia), the Association of Issuing Bodies for franchised stores or stores located in third‑party properties (market‑based electricity in Poland, Slovakia and the Czech Republic), the Unidad de Planeación Minero‑Energética (market‑based electricity in Colombia), and United for Efficiency (U4E), a UNEP‑led initiative (market‑based electricity in Morocco); (vi) fuels used in the light‑vehicle fleet – emission factors defined by the Greenhouse Gas Protocol; heating – for the calculation of emissions associated with heat consumption under the market‑based method in Poland, emission factors published by the Urząd Regulacji Energetyki (URE) were used.
For the calculation of Scope 1 GHG emissions by gas, emission factors defined by the IPCC were used for stationary combustion, refrigerant gases and enteric emissions, and by the Greenhouse Gas Protocol for fuels used in the light‑vehicle fleet. For the disaggregation of Scope 2 emissions, the proportions of each GHG in the emission factors of the International Energy Agency were considered.
Note 2: The calculation of Scope 3 emissions considered the following: C1 – in the absence of validated data provided by suppliers, the weight and/or value of purchased products was used together with emission factors from Agribalyse and the Environmental Protection Agency (EPA), namely the Environmentally‑Extended Input‑Output (EEIO) factors. For the purchase of services, EEIO factors from the EPA were used. Emissions associated with water consumption were also considered using factors from the UK Department for Environment, Food & Rural Affairs (DEFRA); C2 – EEIO emission factors from the EPA were used for the different types of investment; C3 – this category includes “Well‑to‑Tank” (WTT) emissions associated with the extraction, production and transport of energy (electricity, heating and fuels) not included in Scope 1 or 2, using emission factors from DEFRA and the International Energy Agency (IEA); C4 – this category includes transport emissions, as well as WTT emissions associated with the extraction, production and transport of fuels used in the transport of goods between the Group’s operational units and customer deliveries, using DEFRA factors; C5 – DEFRA factors were used for the different treatment pathways of waste generated in operations, customer waste and wastewater; C6 – travel‑related emissions include air and rail travel and hotel stays, using DEFRA factors (air travel includes non‑CO2 effects), including WTT emissions; C7 – the calculation of commuting emissions excludes employees with company cars (reported under Scope 1) and takes into account the remote‑working policy of the Group Companies. A customised emission factor was developed based on DEFRA factors and statistical data on average commuting distance by mode of transport; C10 – this category includes emissions associated with the processing of products sold by JMA to external companies, using emission factors from Agribalyse and EEIO factors from the EPA; C11 – this category includes direct emissions from sold electrical and electronic products and fuels, using IEA emission factors for the energy consumption of electrical and electronic products, and DEFRA factors for direct emissions associated with fuel consumption. Emissions resulting from the use of agricultural by‑products sold to third parties, such as manure, which is applied as fertiliser and therefore associated with N2O emissions, are also included. In this case, data from the Portuguese Code of Good Agricultural Practices and emission factors from the Portuguese Environment Agency and the IPCC were used; C12 – this category includes end‑of‑life emissions of products and respective packaging using DEFRA factors; C15 – this category includes the Group Companies’ investments in subsidiaries or joint ventures, and emissions are calculated using EEIO factors from the EPA or published emissions from investees. The remaining Scope 3 emission categories were not considered as they are either not applicable to the Group’s activities or not deemed materially relevant given its business model. In particular, no relevant activities were identified in categories C8 (upstream leased assets), C9 (downstream transportation and distribution), C13 (downstream leased assets) and C14 (franchises).
Note 3: Scope 1 GHG emissions from the activities of our Companies are not covered by the European Emissions Trading System or any other regulated emissions trading schemes.
Note 4: Emissions from JMA’s agricultural and livestock activities include enteric emissions from cattle, sheep and goats, the use of chemical fertilisers and manure management.
Note 5: Parameter C14 includes franchising and similar models, currently reported under scopes 1 and 2 emissions.
Note 6: In the context of preparing the Climate Transition Plan, the Group carried out a qualitative assessment of the potential “locked‑in” greenhouse gas (GHG) emissions associated with its main assets and products. For this purpose, the operational characteristics of the relevant assets were analysed, including stores, distribution centres, industrial infrastructures, as well as their useful life, energy intensity, and technological renewal cycles. Considering the nature of the Group’s activities, centred on food retail, no industrial assets structurally intensive in carbon were identified that could generate significant and unavoidable emissions over extended time horizons.
The Group’s main operational assets are subject to regular cycles of modernisation and technological replacement, including the progressive substitution of refrigeration equipment with solutions featuring lower global warming potential and the increased use of electricity from renewable sources. Based on the assessment carried out, the Group concluded that the low value of its “locked‑in” GHG emissions associated with its main assets or products is not sufficiently material to compromise the achievement of the GHG emissions reduction targets defined in the climate transition plan or to give rise to significant transition risks.
Note 7: The Group assessed the exclusion criteria applicable to the EU Paris‑Aligned Benchmarks, as defined in Commission Delegated Regulation (EU) 2020/1818, which sets out the minimum requirements for benchmarks aligned with the Paris Agreement.
Based on this analysis, the Group does not conduct activities that would trigger automatic exclusion from these benchmarks, namely activities related to the exploration, production or processing of thermal coal, oil or gas, or other carbon‑intensive activities explicitly excluded under the aforementioned regulation. Consequently, the Group’s exclusion from indices that apply these methodologies lies solely at the discretion of the entities responsible for managing them.

Regarding scope 3 emissions, an 8.9% reduction was recorded, resulting from the update of emission factors, particularly for food products. The variation in scope 3 emissions is also associated with the use of estimates in the calculation of these emissions, which are largely indexed to the volume of purchases and sales of the Companies.

In 2025, emissions calculated on the basis of primary data represented 12.0% of total scope 3 emissions. To increase our understanding of the carbon footprint of our supply chain, we launched a communication platform with suppliers and, in 2024, initiated an engagement programme aimed at sharing the Companies’ decarbonisation objectives and beginning the exchange of data that will improve the accuracy of our value chain carbon footprint.

The interaction with some of the main suppliers of Biedronka, Pingo Doce, Recheio, Ara, Hebe and JMA revealed a diverse landscape in terms of commitment and actions implemented to reduce GHG emissions. The majority of the 52 suppliers contacted in 2025 demonstrate alignment with international GHG accounting standards, with 48% updating their inventories annually and 38% ensuring third‑party verification of their emissions. Regarding emissions reduction targets, 58% of the suppliers contacted set targets for Scope 1 and 2 emissions, and 30% also include targets for Scope 3. Additionally, 21% of these 52 suppliers have targets validated by the Science Based Targets initiative (SBTi), and 17% are in the process of defining their targets, which shows interest from our supply chain regarding the commitment to mitigate climate change. The implementation of climate strategies is another positive aspect, with 50% of the suppliers contacted publishing climate transition or decarbonisation plans.

The actions implemented by the suppliers contacted to reduce energy consumption and GHG emissions are diverse. The most frequently reported measure is the improvement of energy efficiency through technological upgrades and modernisation of equipment, adopted by 81% of the 52 suppliers who responded. Additionally, 60% mention employee training on energy efficiency practices, and 56% indicate carrying out energy audits and/or implementing energy efficiency plans. The purchase and/or generation of renewable energy (including PPAs, green tariffs and on‑site production) is reported by 54% of suppliers. In more specific measures, 28.8% report the use of natural or low‑GWP refrigerant gases in HVAC and refrigeration systems, and 23% indicate actions to reduce transport‑related emissions.

Close-up fo a customer taking a takeaway meal from a refrigerator at the store (photo)

The additional measures specified by suppliers highlight a reinforcement of decarbonisation strategies, based on structural investments and integrated approaches. These include the installation of photovoltaic units for self‑consumption and the construction of larger solar plants, as well as the modernisation of industrial infrastructures, including more efficient refrigeration systems, heat recovery, cogeneration and process electrification. Several suppliers also report the implementation of corporate energy efficiency programmes with defined targets and indicators, as well as the definition of formal decarbonisation strategies with carbon‑neutral or net‑zero objectives by 2040-2050. Additionally, some initiatives focus on the supply chain and product reformulation, prioritising raw materials with lower carbon intensity, as well as reducing the consumption of natural resources.

With the aim of obtaining primary data with greater granularity from suppliers, Biedronka has been developing carbon footprint calculators for key Private Brand and perishable products, having developed eight calculators and organised, in 2025, five workshops for 320 suppliers. JMA has also been calculating the carbon footprint of its products, having already obtained carbon footprint certification for Best Farmer Aberdeen Angus beef (2024) and for Ovinos da Tapada lamb (2025).

As our reliance on estimates for calculating scope 3 emissions decreases, it will become easier to identify additional opportunities to reduce the carbon footprint together with our suppliers and thus converge with our reduction targets for this scope, as defined in our Climate Transition Plan and in Commitments”.

Regarding GHG emissions intensity (scopes 1, 2 and 3) based on net sales (per 1,000 euros of sales), this decreased from 1.015 to 0.862 tonnes of CO2e, reflecting increased efficiency in our operations.

GHG emissions intensity based on net revenue

GHG intensity


2025


2024


Δ 2025/2024

Total carbon footprint (t CO2e)1


31,009,473


*33,963,542


-8.7%

Scope 1 – direct impacts


242,572


204,133


+18.8%

Scope 2 – indirect impacts


543,617


580,258


-6.3%

Scope 3 – other indirect impacts


30,223,284


33,179,124


-8.9%

Net revenue (million euros)


35,991


33,464


+7.6%

Intensity (t CO2e/000’ euro)


0.862


*1.015


-15.1%

*

Value adjusted following an update to the calculations.

1

The Group’s companies did not purchase carbon credits to offset their Scope 1, 2 or 3 emissions, nor did they develop removal or storage projects within their operations or value chain.

1 Scope 2 market‑based emissions.

Carbon dioxide equivalent (CO₂e)
A metric measure used to compare the emissions from various greenhouse gases on the basis of their global-warming potential, by converting amounts of other gases to the equivalent amount of carbon dioxide with the same global warming potential.
Carbon footprint
The total greenhouse gas emissions resulting from an individual's or organisation's activities.
Decarbonisation
The process of reducing or eliminating carbon dioxide (CO₂) and other greenhouse gas (GHG) emissions from human activities. The primary goal is to achieve net zero emissions by 2050, which means balancing the amount of GHGs emitted with the amount removed from the atmosphere.
Global Warming Potential (GWP)
A measure used to compare the impact of different greenhouse gases on global warming over a specific period, usually 100 years. GWP indicates how much heat a greenhouse gas traps in the atmosphere compared to carbon dioxide (CO₂), which has a GWP of 1. For example, methane (CH₄) has a GWP of about 27-30 over 100 years, meaning it is 27-30 times more effective at trapping heat than carbon dioxide.
Greenhouse gases (GHG)
A group of gases contributing to global warming and climate change. The Kyoto Protocol, an environmental agreement adopted by many of the parties to the UN Convention on Climate Change in 1997 to curb global warming, covers seven greenhouse gases: carbon dioxide (CO₂), methane (CH₄), nitrous oxide (N₂O), hydrofluorocarbons (HFCs), perfluorocarbons (PFCs), sulphur hexafluoride (SF₆) and nitrogen trifluoride (NF₃).
Natural refrigeration gases
Substances used in refrigeration systems that naturally occur in the environment. They are seen as more environmentally friendly alternatives to synthetic refrigerants due to their lower global warming potential (GWP). Common natural refrigerants include ammonia (NH₃), carbon dioxide (CO₂), hydrocarbons (e.g., propane, isobutane), water (H₂O) and air.
Perishable goods
Products with a limited shelf life and that require proper storage to prevent spoilage, for instance, fresh fruits, vegetables, ready-to-eat food, meat and fish sold at the counter and dairy products.
Refrigeration gases
Refrigeration gases, or refrigerants, are substances used in refrigeration and air conditioning systems to transfer heat and create cooling. These gases change phases from liquid to gas and back, absorbing and releasing heat in the process. Common types of refrigeration gases include chlorofluorocarbons (CFCs), hydrochlorofluorocarbons (HCFCs), hydrofluorocarbons (HFCs), and natural refrigerants.
Science Based Targets (SBT)
Science-based targets offer companies a clear roadmap to reduce greenhouse gas (GHG) emissions in alignment with the latest climate science, showcasing their dedication to ambitious climate action. These targets are crafted to achieve the goals of the Paris Agreement.
Scope 3 emissions
Indirect emissions generated by third-party companies throughout the reporting organisation's value chain (e.g., transport and purchased goods and services).

general tags

esrs tags

Tag Manager

general tags

esrs tags

Results