The way we manage the materials we use – from Private Brand and service packaging to single‑use items – is part of our ongoing effort with our value chain to ensure that their development is designed for reuse or recycling.
We promote ecodesign, focusing on eliminating problematic components and prioritising packaging made from a single material that is compatible with existing sorting infrastructures, thus keeping resources in productive cycles. We also incorporate recycled materials, helping reduce the use of virgin resources and fostering circularity across our value chain. In addition, we also adopt reusable solutions, both in transport packaging and logistics operations and in the formats we offer to consumers, avoiding disposable alternatives.
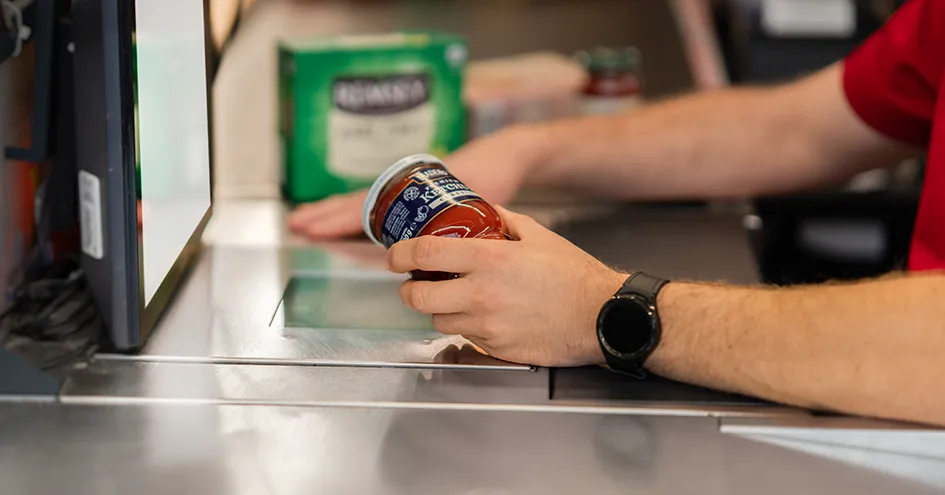
Main materials used
In this report, the tables in this chapter now include the consumption of single‑use plastics and single‑use paper. Previously, single‑use plastic (SUP) consumption was presented in a standalone table – which has now been removed – and single‑use paper consumption is now disclosed in greater detail. Due to this new reporting approach, the 2024 figures were recalculated to ensure an accurate analysis of consumption trends.
Total material consumption (tonnes) |
|
2025 |
|
2024 |
|
Δ 2025/2024 |
||||||||||||
|---|---|---|---|---|---|---|---|---|---|---|---|---|---|---|---|---|---|---|
Consumption by business unit |
|
560,709 |
|
537,664 |
|
+4.3% |
||||||||||||
Biedronka (Poland) |
|
431,002 |
|
403,552 |
|
+6.8% |
||||||||||||
Biedronka (Slovakia) |
|
260 |
|
0 |
|
– |
||||||||||||
Hebe |
|
1,255 |
|
1,465 |
|
-14.3% |
||||||||||||
Pingo Doce1 |
|
67,753 |
|
71,777 |
|
-5.6% |
||||||||||||
Recheio |
|
16,214 |
|
15,149 |
|
+7.0% |
||||||||||||
Ara |
|
44,225 |
|
45,721 |
|
-3.3% |
||||||||||||
Private Brand and service packaging (by type) |
|
514,829 |
|
492,517 |
|
+4.5% |
||||||||||||
Paper and cardboard |
|
210,673 |
|
204,348 |
|
+3.1% |
||||||||||||
Cardboard packaging for liquid products2 |
|
17,825 |
|
15,176 |
|
+17.5% |
||||||||||||
Plastic |
|
160,370 |
|
158,994 |
|
+0.9% |
||||||||||||
Glass |
|
96,833 |
|
86,740 |
|
+11.6% |
||||||||||||
Steel |
|
23,039 |
|
20,349 |
|
+13.2% |
||||||||||||
Other materials3 |
|
6,089 |
|
6,910 |
|
-11.9% |
||||||||||||
Other Single Use Plastics (SUP) |
|
29,004 |
|
28,823 |
|
+0.6% |
||||||||||||
Check-out bags |
|
11,388 |
|
10,073 |
|
+13.1% |
||||||||||||
Wrapping film |
|
3,374 |
|
3,328 |
|
+1.4% |
||||||||||||
Rubbish bags |
|
14,028 |
|
15,331 |
|
-8.5% |
||||||||||||
Other SUP4 |
|
214 |
|
91 |
|
+135.2% |
||||||||||||
Other Single Use Paper |
|
16,876 |
|
16,323 |
|
+3.4% |
||||||||||||
Check-out bags |
|
1,520 |
|
1,439 |
|
+5.6% |
||||||||||||
Other disposable paper products5 |
|
1,252 |
|
1,218 |
|
+2.8% |
||||||||||||
Office paper |
|
855 |
|
953 |
|
-10.3% |
||||||||||||
Promotional leaflets |
|
12,264 |
|
11,464 |
|
+7.0% |
||||||||||||
Publications |
|
985 |
|
1,249 |
|
-21.1% |
||||||||||||
|
||||||||||||||||||
Total recycled material incorporated (tonnes) |
|
2025 |
|
2024 |
|
Δ 2025/2024 |
||||||||||||
|---|---|---|---|---|---|---|---|---|---|---|---|---|---|---|---|---|---|---|
Per business unit |
|
241,802 |
|
239,667 |
|
+0.9% |
||||||||||||
Biedronka |
|
196,778 |
|
190,776 |
|
+3.1% |
||||||||||||
Biedronka Slovakia |
|
0 |
|
0 |
|
– |
||||||||||||
Hebe |
|
316 |
|
224 |
|
+41.1% |
||||||||||||
Pingo Doce1 |
|
25,782 |
|
27,206 |
|
-5.2% |
||||||||||||
Recheio |
|
7,029 |
|
6,633 |
|
+6.0% |
||||||||||||
Ara |
|
11,897 |
|
14,828 |
|
-19.8% |
||||||||||||
Private Brand and service packaging (by type) |
|
214,092 |
|
212,647 |
|
+0.7% |
||||||||||||
Paper and cardboard |
|
169,816 |
|
168,741 |
|
+0.6% |
||||||||||||
Cardboard packaging for liquid products2 |
|
– |
|
– |
|
– |
||||||||||||
Plastic |
|
16,570 |
|
12,142 |
|
+36.5% |
||||||||||||
Glass |
|
27,706 |
|
31,764 |
|
-12.8% |
||||||||||||
Steel |
|
– |
|
– |
|
– |
||||||||||||
Other materials3 |
|
– |
|
– |
|
– |
||||||||||||
Other Single Use Plastics (SUP) |
|
18,709 |
|
16,999 |
|
+10.1% |
||||||||||||
Check-out bags |
|
8,563 |
|
7,399 |
|
+15.7% |
||||||||||||
Wrapping film |
|
112 |
|
113 |
|
-0.9% |
||||||||||||
Rubbish bags |
|
10,034 |
|
9,487 |
|
+5.8% |
||||||||||||
Other SUP4 |
|
– |
|
– |
|
– |
||||||||||||
Other Single Use Paper |
|
9,002 |
|
10,021 |
|
-10.2% |
||||||||||||
Check-out bags |
|
1,066 |
|
1,028 |
|
+3.7% |
||||||||||||
Other disposable paper products5 |
|
– |
|
– |
|
– |
||||||||||||
Office paper |
|
0 |
|
0 |
|
– |
||||||||||||
Promotional leaflets |
|
7,849 |
|
8,987 |
|
-12.7% |
||||||||||||
Publications |
|
87 |
|
6 |
|
+1,350.0% |
||||||||||||
|
||||||||||||||||||
Total material consumption increased by 4.3% in 2025, mainly due to the growth in service packaging and Private Brand packaging. In these packaging categories, the most frequently used materials were paper/cardboard, plastic, and glass. The specific value – materials consumed per million euros of sales – decreased by 3.0% during the year.
Service packaging, Private Brand product packaging, and other single‑use plastic and paper items incorporated 43.1% recycled materials (1.5 p.p. less than in 2024). The share of recycled material reached 64.5% in other single‑use plastics and 53.3% in other disposable paper products.
Group Commitments
We have made several commitments stemming from our adherence to the New Plastics Economy Global Commitment (an initiative of the Ellen MacArthur Foundation and UNEP – the United Nations Environment Programme), as well as from our participation in the Portuguese Plastics Pact, the Polish Plastics Pact, the Colombian Plastics Pact, and the Plastic Waste Coalition of Action of The Consumer Goods Forum. Our objective is to reduce the inflow and outflow of resources used, promoting circularity and following the waste‑management hierarchy, incentivizing reduction, reuse and recycling.
2025 Commitments |
|
Status |
||||
|---|---|---|---|---|---|---|
Ensure that all Private Brand product plastic packaging is reusable or recyclable |
|
56.7% of the plastic packaging of our Own Brand products is recyclable (0.4 p.p. less than in 2024)1. This percentage takes into account the different polymers and plastic packaging formats, as well as the existence and effectiveness of sorting and recycling systems in the countries where we operate. Although our Companies have continued to invest in packaging that complies with ecodesign principles, and despite the presence of recycling industries, sorting solutions are still lacking for certain streams (e.g., multilayer flexible polypropylene plastics and rigid polystyrene packaging). As such, some plastic packaging formats remain classified as “non‑recyclable” according to the methodology used, even when local systems exist for sorting and downcycling. |
||||
Incorporate at least 25% recycled material into the plastic packaging of our Private Brand products. |
|
In 2025 we incorporated 14.4% recycled polymers, an increase of 2.8 p.p. compared with 2024. In total, more than 25 thousand tonnes of recycled plastic were used, a value 28.4% higher than the previous year. |
||||
Reduce the specific consumption of plastic, measured in tonnes of plastic packaging per million euros of sales, by 10% compared with 2018. |
|
We reduced the specific consumption of plastic, measured in tonnes of plastic packaging per million euros of sales, by 45% compared with 2018. |
||||
Reduce the amount of virgin plastic used in the packaging of Private Brand products by 15% compared with 2018. |
|
We reduced the consumption of virgin plastic used in the packaging under our responsibility by 3.8% compared with 2018. |
||||
|
||||||
Over the past few years, market conditions for the collection of packaging waste and the availability of recycled plastic to incorporate into new packaging (particularly food‑contact applications) have evolved very little in the countries where we operate. For these reasons, and as we have been anticipating, by the end of 2025 we were unable to meet two of our plastic‑related commitments:
ensuring that at least 25% recycled plastic is used in plastic packaging;
reducing virgin plastic use by 15% compared with 2018.
In 2025, the Ellen MacArthur Foundation launched the 2030 Global Commitment, and the commitments proposed by the Group for its Private Brand were accepted:
reduce virgin plastic in plastic packaging by 5% compared with 2018;
increase the incorporation of recycled plastic in packaging to 20%;
ensure that 100% of plastic packaging placed on the market is designed to be recyclable.