Within the scope of implementing our Climate Transition Plan, we carried out a set of actions that serve as levers for our decarbonisation, of which we highlight the following for reducing Scope 1, 2 and 3 emissions:
the transition to natural refrigerant gases and those with low global warming potential (scope 1);
investment in renewable energy sources and increased energy efficiency in our stores (scope 1 and 2);
the transition away from fossil fuels and improved logistics efficiency (scopes 1, 2 and 3);
the promotion of the circular economy1(scope 3);
the implementation of a supplier‑engagement programme with the Companies’ key suppliers, aimed at reducing the Group’s GHG emissions associated with the procurement and sale of products (scope 3).
The images below illustrate the planned reduction pathway for scope 1 and 2 GHG emissions for the periods up to 2045.
Reduction plan expected for GHG emissions (scopes 1 and 2) until 2033.

Reduction plan expected for GHG emissions (scopes 1 and 2) until 2045.

Additional information is provided in “Appendix 3 – Total GHG emissions disaggregated by Scopes 1 and 2 and significant Scope 3”.
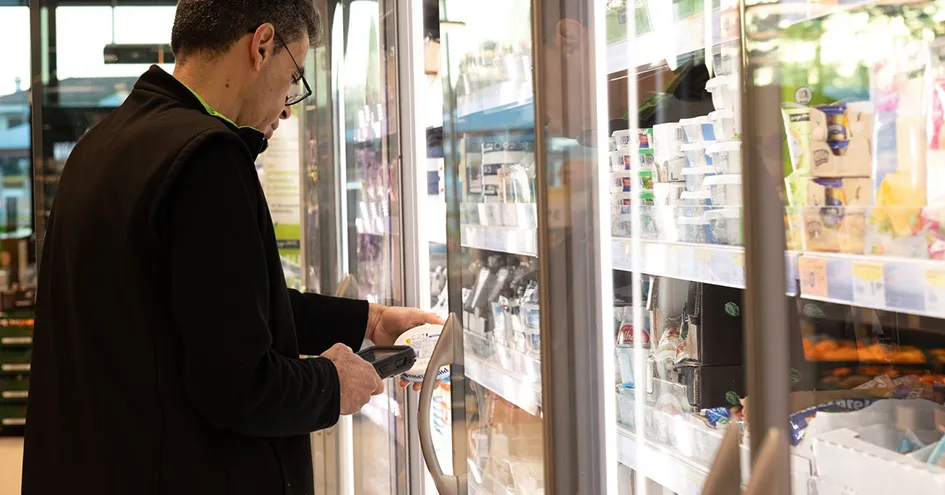
Management of refrigerant gases
In the food distribution business, in which we stand out for the quality of our specialised perishable offer, refrigeration and air‑conditioning systems play a central role. These systems are essential to ensure food quality, safety and preservation, while also playing a decisive role in combating food waste.
However, the use of refrigeration and air‑conditioning requires energy consumption and, due to leaks resulting from their operation, greenhouse gases are also emitted. To reduce these impacts, we invest in more efficient equipment. As part of managing carbon emissions associated with the use of refrigerant gases in these systems, leak‑control technologies are also installed and, whenever possible and on a voluntary basis, we opt for natural refrigerant gases in industrial cooling facilities or low‑GWP gases in heating, ventilation and air‑conditioning installations.
Establishments using natural refrigerant gases
|
|
Total |
|
Progress1 |
||||||||||
|---|---|---|---|---|---|---|---|---|---|---|---|---|---|---|
Type of establishment |
|
2025 |
|
2024 |
|
2025 |
|
2024 |
||||||
Stores – centralised refrigeration system |
|
3,917 |
|
3,439 |
|
64% |
|
*60% |
||||||
Stores – stand-alone equipment |
|
5,681 |
|
5,238 |
|
93% |
|
*92% |
||||||
Distribution centres and industrial units – centralised refrigeration system |
|
27 |
|
25 |
|
73% |
|
69% |
||||||
|
||||||||||||||
As a result of a process of inventorying and systematising equipment in our facilities, it was possible to determine more accurately the progress made in the use of natural refrigerant gases or gases with low global warming potential. In 2025, 73% of distribution centres and industrial units and 64% of stores used this gases in their cooling plants. Autonomous refrigeration units, such as freezer chests, are present in 93% of our stores (3,658 at Biedronka, 1,511 at Ara, 472 at Pingo Doce and 40 at Recheio), reflecting the investment we have been making over time. Ongoing investment in refrigeration systems using natural refrigerants or low‑global‑warming‑potential gases reduces direct emissions associated with refrigerant leaks and lowers electricity consumption through more efficient equipment, with an estimated mitigation potential of over 61 thousand tonnes of CO2e.
Energy efficiency and renewable energies
To reduce our carbon emissions associated with energy consumption, we implemented a set of good practices. The store refurbishment and opening plan includes solutions such as:
renewable energy generation technologies;
energy control and management systems;
efficient refrigeration technologies and freezer chests;
efficient lighting.
Renewable Energy
|
|
Number of buildings |
|
Energy (GJ/year) |
|
Savings1 (t CO2e/year) |
||||||||||||
|---|---|---|---|---|---|---|---|---|---|---|---|---|---|---|---|---|---|---|
Technology |
|
2025 |
|
2024 |
|
2025 |
|
2024 |
|
2025 |
|
2024 |
||||||
Photovoltaic panels for |
|
2,721 |
|
2,101 |
|
490,992 |
|
295,776 |
|
64,619 |
|
35,567 |
||||||
Biedronka |
|
2,209 |
|
1,804 |
|
350,930 |
|
202,420 |
|
59,169 |
|
31,604 |
||||||
Ara |
|
368 |
|
249 |
|
52,648 |
|
26,307 |
|
2,588 |
|
818 |
||||||
Pingo Doce2 |
|
56 |
|
36 |
|
65,772 |
|
48,820 |
|
2,153 |
|
2,287 |
||||||
Recheio |
|
10 |
|
10 |
|
12,124 |
|
11,836 |
|
397 |
|
558 |
||||||
JMA |
|
8 |
|
2 |
|
9,518 |
|
6,393 |
|
312 |
|
300 |
||||||
Lamp posts and security system powered by photovoltaic panels and/or wind turbines |
|
8 |
|
9 |
|
581 |
|
584 |
|
27.0 |
|
27.7 |
||||||
Pingo Doce2 |
|
1 |
|
1 |
|
130 |
|
130 |
|
4.0 |
|
6.0 |
||||||
Recheio |
|
5 |
|
5 |
|
439 |
|
439 |
|
21.0 |
|
21.0 |
||||||
Biedronka |
|
1 |
|
1 |
|
9 |
|
10 |
|
1.9 |
|
0.4 |
||||||
JMA |
|
1 |
|
2 |
|
3 |
|
6 |
|
0.1 |
|
0.3 |
||||||
Solar collectors to produce hot water used for heating water and/or in the air conditioning system |
|
13 |
|
16 |
|
2,593 |
|
3,952 |
|
87 |
|
185 |
||||||
Pingo Doce |
|
6 |
|
7 |
|
1,852 |
|
3,399 |
|
61 |
|
159 |
||||||
Recheio |
|
4 |
|
7 |
|
118 |
|
489 |
|
6 |
|
23 |
||||||
JMA |
|
3 |
|
2 |
|
623 |
|
64 |
|
20 |
|
3 |
||||||
Geothermal recovery systems |
|
48 |
|
20 |
|
7,853 |
|
4,467 |
|
1,147 |
|
697 |
||||||
Biedronka (heat pumps) |
|
47 |
|
20 |
|
6,547 |
|
4,467 |
|
1,104 |
|
697 |
||||||
JMA |
|
1 |
|
– |
|
1,307 |
|
– |
|
43 |
|
– |
||||||
|
||||||||||||||||||
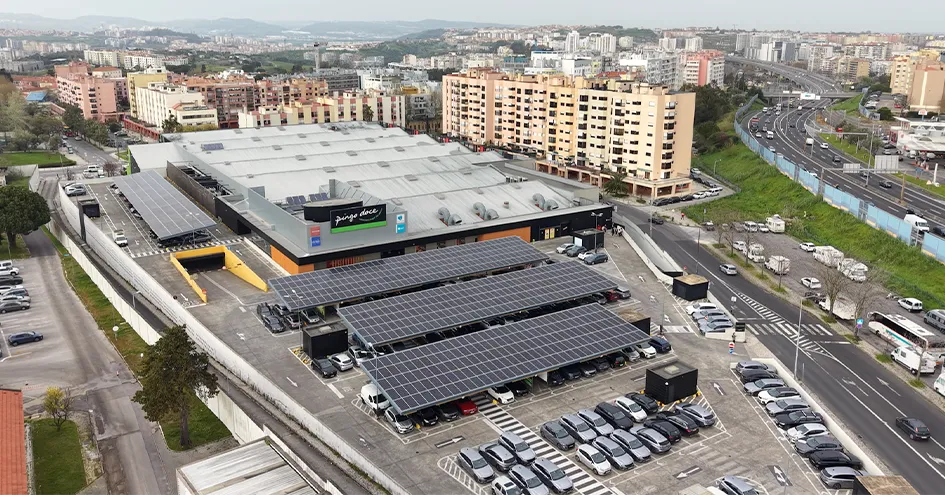
In 2025, in line with the Companies’ investment plans and with the objectives defined in our Climate Transition Plan, we continued to advance in the installation of photovoltaic panels for self‑consumption, particularly in Poland and Colombia. Investment in renewable energy generation and in more efficient equipment ensured the production of more than 502 thousand GJ, a 64% increase compared with 2024.
Since July 2018, the operations of our banners in Portugal have been powered by electricity from renewable sources through the purchase of Guarantees of Origin (GO) for more than 1.9 million GJ – equivalent to avoid almost 60 thousand tonnes of carbon dioxide equivalent. Biedronka, through the purchase of GO and a virtual solar photovoltaic power purchase agreement (VPPA), ensured the origin of more than 527 thousand GJ and avoided the emission of 89 thousand tonnes of carbon dioxide equivalent. In 2025, investments in photovoltaic panels, GO and other renewable‑energy technologies across the different Companies avoided the emission of 214 thousand tonnes of carbon dioxide equivalent.
Raising employee awareness of waste recovery and the efficient use of water and energy also contributed to the environmental performance of our facilities. The “Water and Energy Consumption Management Teams” project, launched in 2011 in Pingo Doce and Recheio stores, enabled a reduction of 440 thousand m3 of water and 103 thousand MWh of energy, equivalent to cumulative savings of more than 11.9 million euros2. At Pingo Doce, the actions of these teams form part of the “Todos pelo Ambiente” (“All for the Environment”) initiative. The “Let’s Go Green” project, developed in 2015 with the same objectives, covers office buildings in Portugal, Poland and Colombia.
Investment in energy efficiency, renewable energy production for self‑consumption and low‑GWP refrigerant gases has exceeded 790 million euros since 2017, with 2025 recording an investment of 100 million euros, reflecting our strengthened focus on reducing energy consumption and carbon emissions. Our payback period averages three years and has already avoided more than 1.25 million tonnes of CO2e emissions.
In the coming years, and with a view to meeting our short‑term scopes 1 and 2 targets, the implementation of decarbonisation measures will remain aligned with the Companies’ investment plans. In terms of operating expenses, we will continue our initiatives to procure renewable energy through Guarantees of Origin (GOs), Power Purchase Agreements (PPAs) and Virtual Power Purchase Agreements (VPPAs), which encourage investment in the installation of new renewable energy generation capacity.
Additional information on the CapEx associated with these activities is detailed in “Disclosures under Article 8 of Regulation (EU) 2020/852 (Taxonomy Regulation)”.
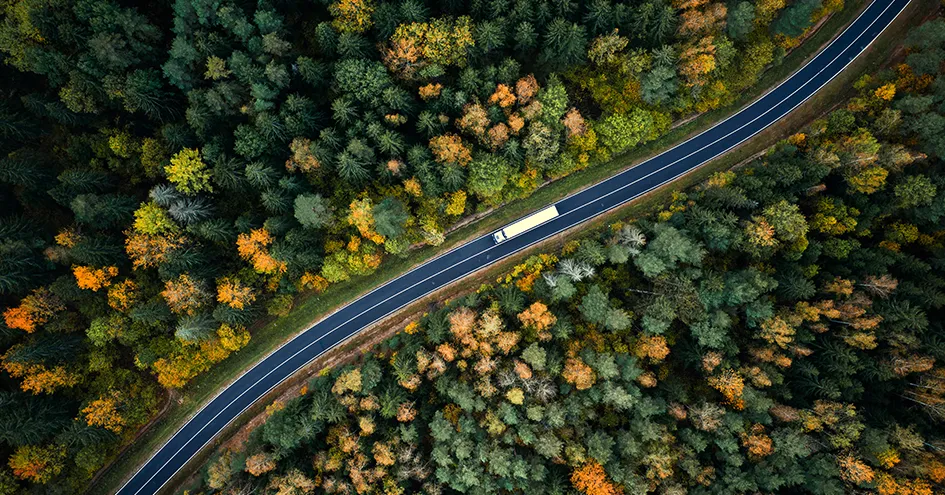
Fossil fuels and increasing logistics efficiency
Our plan to reduce carbon emissions associated with fossil‑fuel consumption in operations and logistics involves:
increasing the incorporation of electric and/or plug‑in hybrid vehicles in our fleet and increasing the use of biofuels and hydrogen;
progressively reducing the use of fossil fuels in operations through the electrification of equipment and/or the use of biofuels;
improving the efficiency of logistics processes.
In 2025, 12.2% of our light‑vehicle fleet in Portugal and 0.9% in Poland were electric or hybrid, in line with 2023 levels (11.7% in Portugal and 0.8% in Poland). In Slovakia and Colombia, the existing vehicles are combustion‑engine.
Backhauling and fronthauling operations
To improve the efficiency of logistics processes, we are optimising distribution routes – through backhauling3 and fronthauling4 – and increasing investment in more efficient trucks.
In 2025, backhauling operations prevented 46.7 million kilometres from being travelled, 6 million kilometres more than in 2024 (3%), contributing to a reduction of 40,920 tonnes of carbon dioxide equivalent. Colombia continues to show no significant progress in this project, due both to the limited availability of space in trucks to expand reverse logistics and to the distance between suppliers and return routes. Backhauling has not yet been implemented in Slovakia, given the small scale of the operation, with few stores and only one distribution centre.
Backhauling
Thousands of km avoided

Emissons avoided
(t CO2e)

Fronthauling, which exists only in Portugal, saved 114 thousand kilometres (24.2% less than in 2024) and avoided the emission of 100 tonnes of carbon dioxide equivalent.
At Ara, the project for transporting non‑palletised goods – focused on optimising loads between suppliers’ facilities and distribution centres – generated savings of more than 600 thousand kilometres (40% less compared with 2024), avoiding the emission of 1,034 tonnes of carbon dioxide equivalent. Meanwhile, the by‑truck project – which uses additional trailers to supply the most distant stores – avoided 2.6 million kilometres (29.4% more than in 2024), corresponding to a reduction of 2,082 tonnes of carbon dioxide equivalent.
Breakdown of goods transport vehicles according to the Euro standards

In 2025, we had 386 more Euro VI trucks than in 2024, keeping the vast majority of the fleet, we use within Euro V and Euro VI standards (96% of the total, 1 p.p. more than in 2024). In Colombia, the fleet came to include 30 Euro VI trucks, which made it possible to reduce the number of trucks complying with Euro V or lower standards.
In 2025, we reduced carbon emissions (per thousand pallets) associated with the transport of goods to stores by 6.9% compared with 2021 (baseline year). Our goal is to reduce carbon dioxide equivalent emissions per thousand pallets transported by 5% compared with 2021 by the end of 2026.
Carbon emissions associated with pallet transport
|
|
2021 |
|
2024 |
|
20251 |
||||
|---|---|---|---|---|---|---|---|---|---|---|
Transport of goods to stores (km) |
|
249,551,570 |
|
263,407,687 |
|
268,965,377 |
||||
Transport of goods to stores (t CO2e) |
|
205,375 |
|
214,794 |
|
218,270 |
||||
Carbon emissions from transporting goods to stores, per 1,000 pallets transported |
|
5.57 |
|
5.22 |
|
5.14 |
||||
|
||||||||||
Logistics decarbonisation
In 2025, we continued to strengthen our logistics decarbonisation journey – recognised at the European level – by reinforcing our position in the Lean & Green initiative, which aims to achieve carbon neutrality in logistics activities by 2050.
Recheio earned its first Lean & Green star after reducing carbon emissions by 25.1% between 2021 and 2024, measured in tonnes of CO₂e per thousand pallets handled, with validation by an independent audit. Terra Alegre obtained its second Lean & Green star as a result of a cumulative reduction of 30.5% in logistics‑related CO₂e emissions between 2022 and 2024 and of the high quality of the information reported, also benefitting of the commitment to cooperating with logistics partners.
These results build on the milestones reached in 2024, when Pingo Doce positioned itself as a benchmark of excellence by becoming the first company in Portugal and the fourth in Europe to achieve four Lean & Green stars, following a 55% reduction in CO₂e emissions from its logistics operations in mainland Portugal compared to 2018.
Biedronka also distinguished itself in 2024 by being awarded its second Lean & Green star (the first has been achieved in 2022). This recognition stems from a further 12% reduction in carbon emissions between 2021 and 2023, while maintaining its initial 20% reduction target, and covers 12 distribution centres responsible for more than 65% of the Company’s transported volume.
1 More information on our circular economy promotion actions can be found in “Resource use and circular economy”.
2 Value calculated based on regular internal benchmarking reports from which stores refurbished in 2024 and 2025 were excluded, as their consumption levels are not comparable.
3 After delivering products to our stores, the return route includes a stop at the Group’s suppliers’ facilities to collect goods and transport them to the distribution centre.
4 After delivering products to our distribution centres, the suppliers’ return route to their facilities includes a stop at the Group’s stores to deliver goods. This project exists only in Portugal.