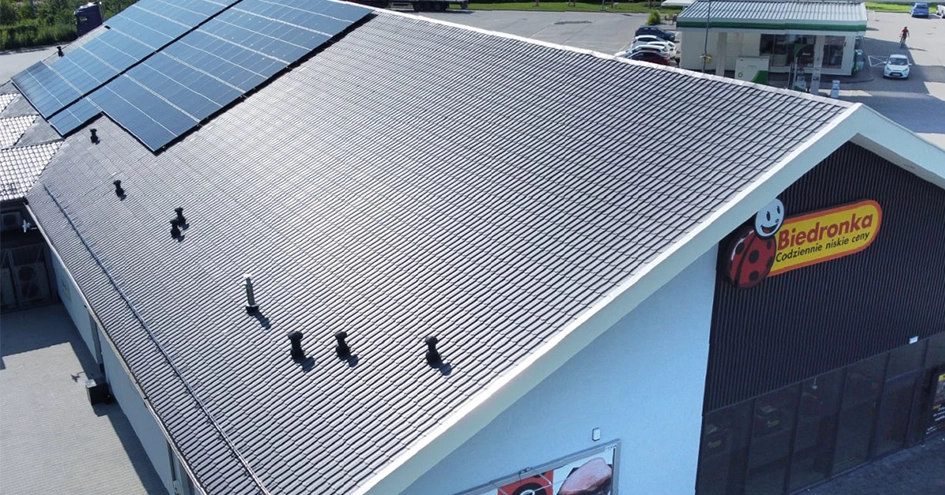
Our scope 1 and 2 GHG emissions corresponded to 783,000 tonnes of carbon dioxide equivalent (CO2e) in 2024, 15.8% less than in 2023 and 19% less than in 2021, defined as the base year for our SBTi- and Climate Transition Plan-aligned commitments. This reduction is mainly due to the contraction in carbon intensity of the Polish power grid, and to the investments in the purchase and production of renewable energy, as well as to the acquisition of cooling systems with natural or low GWP refrigerant gases.
Scopes 1 and 2 emissions (2024 and 2023)
Carbon footprint (t CO2e)1 |
|
2024 |
|
2023 |
|
Δ 2024/2023 |
||||||||||||||
|---|---|---|---|---|---|---|---|---|---|---|---|---|---|---|---|---|---|---|---|---|
Overall carbon footprint (scopes 1 and 2)2 by GHG |
|
782,610 |
|
*929,714 |
|
-15.8% |
||||||||||||||
Carbon dioxide (CO2) |
|
671,026 |
|
*802,100 |
|
-16.3% |
||||||||||||||
Methane (CH4) |
|
22,543 |
|
*19,354 |
|
+16.5% |
||||||||||||||
Hydrofluorocarbons (HFC) |
|
85,743 |
|
104,914 |
|
-18.3% |
||||||||||||||
Perfluorocarbons (PFC) |
|
0 |
|
0 |
|
– |
||||||||||||||
Nitrous oxide (N2O) |
|
3,298 |
|
*3,346 |
|
-1.4% |
||||||||||||||
Sulphur hexafluoride (SF6) |
|
0 |
|
0 |
|
– |
||||||||||||||
Overall carbon footprint (scopes 1 and 2) |
|
782,610 |
|
*929,714 |
|
-15.8% |
||||||||||||||
Biedronka |
|
609,632 |
|
*747,956 |
|
-18.5% |
||||||||||||||
Hebe |
|
21,023 |
|
*21,217 |
|
-0.9% |
||||||||||||||
Pingo Doce3 |
|
31,348 |
|
40,536 |
|
-22.7% |
||||||||||||||
Recheio |
|
3,758 |
|
3,977 |
|
-5.5% |
||||||||||||||
Ara |
|
87,989 |
|
91,384 |
|
-3.7% |
||||||||||||||
JMA |
|
28,749 |
|
*24,499 |
|
+17.3% |
||||||||||||||
Hussel/Jeronymo4 |
|
111 |
|
145 |
|
-23.4% |
||||||||||||||
Carbon footprint (scope 1 – direct impacts) |
|
203,619 |
|
*240,592 |
|
-15.4% |
||||||||||||||
Refrigerant leaks |
|
85,816 |
|
104,976 |
|
-18.3% |
||||||||||||||
CO2 usage |
|
28,796 |
|
29,166 |
|
-1.3% |
||||||||||||||
Fuel consumption |
|
45,486 |
|
65,459 |
|
-30.5% |
||||||||||||||
Light vehicle fleet |
|
20,448 |
|
21,788 |
|
-6.2% |
||||||||||||||
Emissions from agriculture and livestock farming |
|
23,073 |
|
19,203 |
|
+20.2% |
||||||||||||||
Biogenic CO2 emissions from biomass combustion or biodegradation |
|
0 |
|
0 |
|
– |
||||||||||||||
Carbon footprint (scope 2 – indirect impacts)5 |
|
578,991 |
|
*689,122 |
|
-16.0% |
||||||||||||||
Electricity consumption (market-based) |
|
566,423 |
|
674,052 |
|
-16.0% |
||||||||||||||
Heating (market-based) |
|
12,568 |
|
*15,070 |
|
-16.6% |
||||||||||||||
Electricity consumption (location-based) |
|
747,918 |
|
755,226 |
|
-1.0% |
||||||||||||||
Heating (location-based) |
|
19,311 |
|
*22,956 |
|
-15.9% |
||||||||||||||
Biogenic CO2 emissions from biomass combustion or biodegradation |
|
0 |
|
0 |
|
– |
||||||||||||||
Net revenue (million euros) |
|
33,464 |
|
30,608 |
|
+9.3% |
||||||||||||||
|
||||||||||||||||||||
Scope 3 emissions (2024 and 2023)
Carbon footprint (t CO2e)1 |
|
2024 |
|
2023 |
|
Δ 2024/2023 |
||||
|---|---|---|---|---|---|---|---|---|---|---|
Carbon footprint (scope 3 – other indirect impacts) |
|
32,763,786 |
|
31,228,412 |
|
+4.9% |
||||
Poland |
|
22,972,862 |
|
21,877,554 |
|
+5.0% |
||||
Portugal |
|
6,279,674 |
|
6,043,101 |
|
+3.9% |
||||
Colombia |
|
3,500,778 |
|
3,307,757 |
|
+5.8% |
||||
Morocco |
|
9,423 |
|
– |
|
– |
||||
Czechia and Slovakia |
|
1,049 |
|
– |
|
– |
||||
Carbon footprint (scope 3 – other indirect impacts) |
|
32,763,786 |
|
31,228,412 |
|
+4.9% |
||||
C1. Purchased products and services |
|
28,712,141 |
|
27,001,355 |
|
+6.3% |
||||
C2. Capital goods |
|
452,588 |
|
627,556 |
|
-27.9% |
||||
C3. Fuel and energy related activities |
|
296,397 |
|
307,489 |
|
-3.6% |
||||
C4. Upstream transport and distribution |
|
267,219 |
|
256,781 |
|
+4.1% |
||||
C5. Waste produced in operations |
|
55,254 |
|
57,091 |
|
-3.2% |
||||
C6. Work travel |
|
2,551 |
|
4,841 |
|
-47.3% |
||||
C7. Commuting |
|
21,069 |
|
20,813 |
|
+1.2% |
||||
C8. Assets rented upstream |
|
– |
|
– |
|
– |
||||
C9. Downstream transport and distribution |
|
– |
|
– |
|
– |
||||
C10. Transformation of products sold |
|
1,425 |
|
799 |
|
+78.3% |
||||
C11. Use of products sold |
|
1,624,066 |
|
1,539,946 |
|
+5.5% |
||||
C12. End of life of products sold |
|
1,320,803 |
|
1,402,175 |
|
-5.8% |
||||
C13. Assets rented downstream |
|
– |
|
– |
|
– |
||||
C14. Franchises |
|
– |
|
– |
|
– |
||||
C15. Investments |
|
10,273 |
|
9,566 |
|
+7.4% |
||||
Biogenic CO2 emissions from biomass combustion or biodegradation |
|
0 |
|
0 |
|
– |
||||
Net revenue (million euros) |
|
33,464 |
|
30,608 |
|
+9.3% |
||||
|
||||||||||
A 4.9% increase in scope 3 emissions was recorded, in line with the growth of our business. The increase in scope 3 emissions is also associated with the use of estimates to calculate these emissions, most of which are indexed to the Companies’ sales volume.
In 2024, emissions calculated on the basis of primary data accounted for 12.3% of total scope 3 emissions. We launched a communication platform with suppliers to gain more insight into the carbon footprint of our supply chain.
Interaction with some of Biedronka, Pingo Doce and Recheio’s main suppliers revealed a diverse landscape of commitment and implemented actions to reduce GHG emissions. The majority of the 20 suppliers contacted demonstrate alignment with international GHG accounting standards, with 60% updating their inventories annually and 50% ensuring third-party verification of emissions. As regards emission reduction targets, 50% of the suppliers contacted set targets for scope 1 and 2 emissions, and 30% also included scope 3 targets. Additionally, 30% of these 20 suppliers contacted have validated targets by the Science-Based Targets initiative (SBTi) and 20% are in the process of defining their targets, which reflects the adhesion of our supply chain to the commitment to mitigate climate change. The implementation of climate strategies is another positive aspect, with 50% of suppliers publishing climate transition or decarbonisation plans.
The actions implemented by the contacted suppliers to reduce their energy consumption and GHG emissions are varied and wide-reaching. Performing energy audits and improving the energy efficiency of equipment through technological upgrades are common practices adopted by 80% of the suppliers analysed (20 in total). Approximately 70% of suppliers contacted purchase and generate renewable energy for self-consumption, and employee training in energy efficiency practices is provided by half of the suppliers. In logistics processes, 50% of the suppliers contacted invest in reducing transport emissions, a crucial measure for reducing total emissions associated with the supply chain.
The additional measures specified by suppliers, such as purchasing local raw materials, replacing synthetic fertilisers with natural alternatives, using biogas, and building medium and large photovoltaic plants, demonstrate a continuous effort to innovate and implement low carbon solutions. These initiatives not only contribute to reducing GHG emissions but also to globally promote more sustainable agricultural practices.
To obtain more granular primary data from suppliers, Biedronka has been developing product carbon footprint calculators for its main Private Brand and perishable products. Thus far, five calculators have been created and nine workshops held for 650 suppliers. JMA has also been calculating the carbon footprint of its products, obtaining carbon footprint certification for Best Farmer’s Aberdeen Angus cattle in the first half of 2024.
As our reliance on estimates for calculating scope 3 emissions decreases, it will be easier to identify additional opportunities to reduce supplier carbon emissions and thus converge with our reduction targets for this scope, as set out in our Climate Transition Plan and in “Commitments”.
GHG emissions’ intensity (scopes 1, 2 and 3) based on net revenue fell from 1.051 to 1.002 tonnes of CO2e (per 1,000€ of sales), reflecting the increased efficiency of our operations.
GHG intensity based on net revenue
Carbon footprint (t CO2e)1 |
|
2024 |
|
2023 |
|
Δ 2024/2023 |
||||||
|---|---|---|---|---|---|---|---|---|---|---|---|---|
Total carbon footprint (scopes 1, 2 and 3) |
|
33,546,395 |
|
*32,158,126 |
|
+4.3% |
||||||
Scope 1 – direct impacts |
|
203,619 |
|
*240,592 |
|
-15.4% |
||||||
Scope 2 – indirect impacts |
|
578,992 |
|
*689,121 |
|
-16.0% |
||||||
Scope 3 – other indirect impacts |
|
32,763,786 |
|
*31,228,412 |
|
+4.9% |
||||||
Net revenue (million euros) |
|
33,464 |
|
30,608 |
|
+9.3% |
||||||
Intensity (t CO2e/000’ euro) |
|
1.002 |
|
1.051 |
|
-4.6% |
||||||
|
||||||||||||